
From time to time, Jeremy and myself receive questions from readers that are along this line: “Will the stock market of [insert country] be like Japan’s? Compared to its peak in late 1989, the Nikkei 225 Index – a representation of Japanese stocks – is still 40% lower today.”
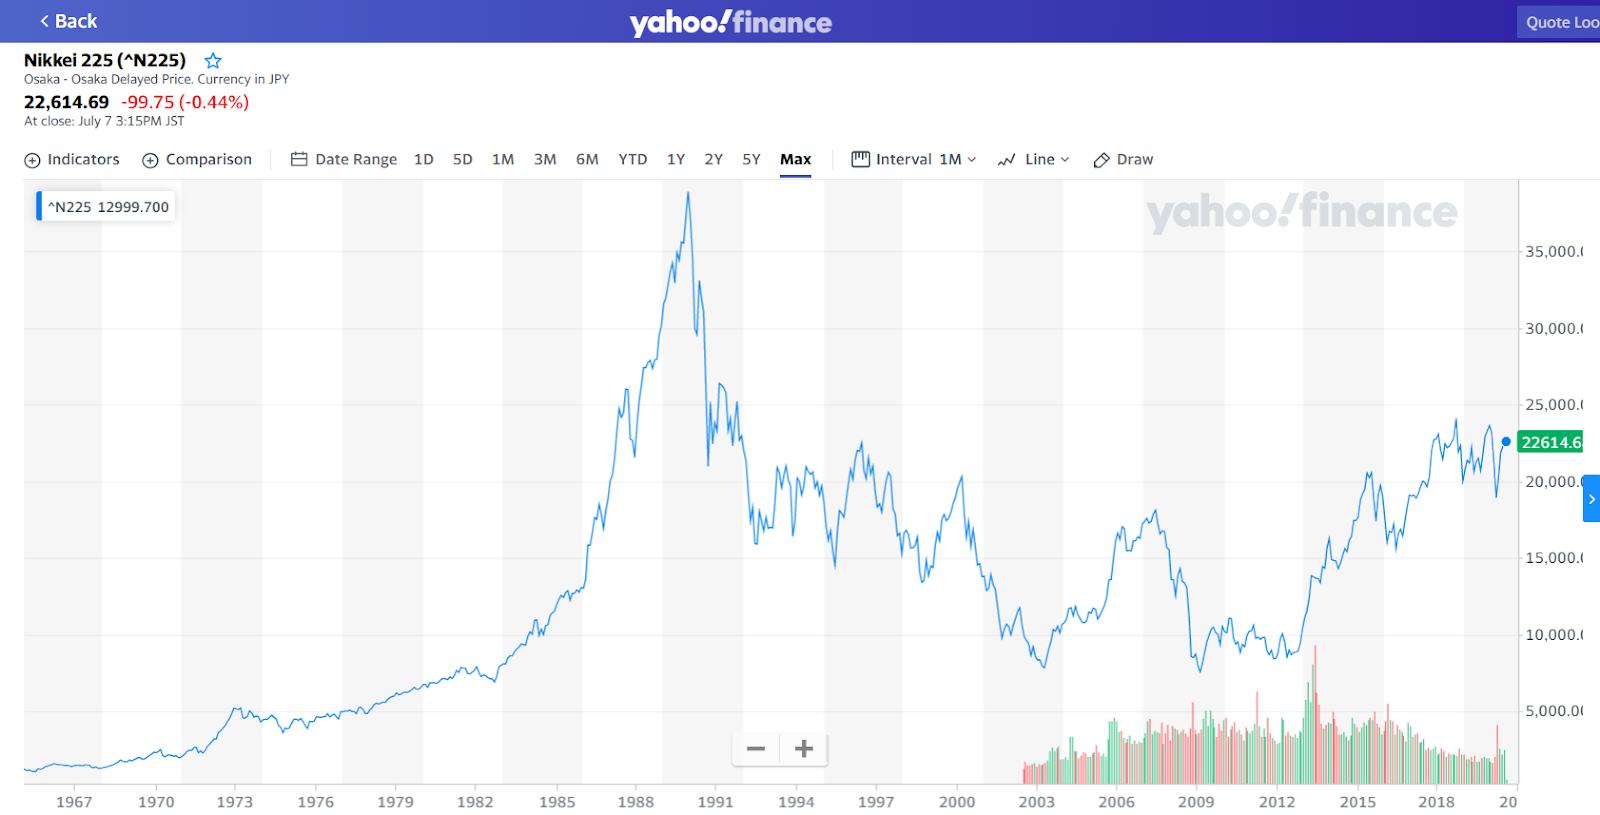
It’s a good question, because Japanese stocks have indeed given investors a horrible return since late 1989, a period of more than 30 years. But perspective is needed when you’re thinking if any country’s stock market will go through a similar run as Japan’s stock market did from 1989 to today. Here’s some data for you to better understand what Japanese stocks went through back then:
- Japanese stocks grew by 900% in US dollar terms in seven years from 1982 to 1989; that’s an annualised return of 39% per year.
- At their peak in late 1989, Japanese stocks carried a CAPE (cyclically-adjusted price-to-earnings) ratio of nearly 100; in comparison, the US stock market’s CAPE ratio was ‘only’ less than 50 during the infamous 1999/2000 dotcom bubble. The CAPE ratio is calculated by dividing a stock’s price with its inflation-adjusted 10-year-average earnings. Near the end of May 2020, Japanese stocks had a CAPE ratio of 19, while US stocks today have a CAPE ratio of 30.
The data above show clearly that Japanese stocks were in an epic bubble in late 1989. It is the bursting of the bubble that has caused the painful loss delivered by Japan’s stock market since then.
If you’re worried about the potential for any country’s stock market to repeat the 1989-present run that Japanese stocks have had, then you should study the valuations of the country’s stock market. But you should note that there are two things that looking at valuations cannot do.
First, valuations cannot tell you the future earnings growth of a country’s stock market. If the earnings of a country’s stocks collapse in the years ahead for whatever reason (natural catastrophe, disease outbreak, war, incompetent leadership etc.), even a low valuation could prove to be expensive.
Second, valuations cannot protect you from short-term declines. What it can only do is to put the odds of success in your favour. In an earlier article, 21 Facts About The Wild World Of Finance and Investing, I shared the two charts below:


They show the returns of the S&P 500 from 1871 to 2013 against its starting valuation for holding periods of 1 year (the first chart) and 10 years (the second chart). You can see that the relationship between valuation and eventual return – the higher the valuation, the lower the return – becomes much tighter when the holding period lengthens.
To end, I have another important takeaway from Japan’s experience: It’s important to diversify geographically. Global stocks have grown by around 5% per year in US dollar terms from 1989 to 2019, despite (1) the terrible performance of Japanese stocks in that period, and (2) Japan accounting for 45% of the global stock market by market capitalisation in early 1989.
Disclaimer: The Good Investors is the personal investing blog of two simple guys who are passionate about educating Singaporeans about stock market investing. By using this Site, you specifically agree that none of the information provided constitutes financial, investment, or other professional advice. It is only intended to provide education. Speak with a professional before making important decisions about your money, your professional life, or even your personal life.
Hi Ser Jin,
Great article. I do wonder what would happen if one bought good Japan shares at the peak of the Japan stockmarket bubble at 1989 and hold until now, what would be the return of those shares be like. I don’t know anything about individual stocks in Japan (presumably the good ones back in 1989 would be Toyota, etc). Japan is a very innovative and wonderful country, but adversely impacted by negative demographic factors and deflation amongst others. Quite a few countries would face similar situation like that in the future such as China and European Union.
Your point about “It’s important to diversify geographically” is something I often overlooked, but I now consider extremely important. Despite the best of humankind, there is often the worst side that will emerge every now and then. The incident of mini nuclear bomb going off (in smaller scale) in some where in the world are something that seem to be difficult to avoid, but may
Hello Teck! Thanks for reading! I will need to find data about the return on individual Japanese shares from 1989 to now; it should be interesting if I can find any data on this. You raised some really good points on the importance of diversification, and the demographics of Japan, China, and the European Union. I agree with them – Ser Jing