REITs investing offers the best of both worlds – dividends and growth. As investors, it’s common to pick REITs based on the latest REIT sector data and financial data from annual reports.
If you wish to gain an edge over your fellow retail investors, I strongly suggest conducting your own site visits at the actual properties.
This guide gives you an introduction to Retail Site Visits. In the following sections, I cover:
- Why conduct site visits?
- Are crowds really returning to pre-COVID levels?
- 5 trends to look out for when doing a site visit to a mall
- How to analyse Shop closures?
- 6 factors of a successful mall
- Closing Thoughts on the Outlook of Singapore Retail
Although I’m using Retail Malls as an example, you can easily extrapolate the thought process for any accessible properties under your desired REIT.
Why conduct site visits?
Many practitioners tout themselves as being real estate experts, crunching numbers in their ivory towers and purporting to understand complexities of the industry.
But can you really understand real estate without visiting the actual property? Would you trust a surgeon who performs only a few operations every year?
On the ground knowledge versus ivory towers
Far too often, financial analysts provide their analyses and forecasts from the cool comfort of their office without having a good feel of the physical assets they are writing about. They are relying on financial data provided by the listed companies’ management, and most of the data are backward looking.
With site visits, we can better contextualize and understand the physical constraints and the strengths of a retail mall. We can tell how the mall relates to the other buildings in the neighbourhood, where consumer traffic comes from and where they go to.
If you want the latest “ground data” about the real estate assets, your best bet would be going for a physical, on-site visit.
Are the crowds really returning to pre COVID levels?
Even prior to the COVID-19 pandemic, retail and F&B business have been suffering. The onset of COVID-19 pushed foot traffic into malls right off the cliff.
With Phase 2 of the Circuit Breaker, the Singapore government has relaxed the movement restrictions, allowing retail businesses to reopen the physical outlets. As a result, foot traffic in retail malls has been trending up, and many commentators have touted the ‘recovery’ of the retail sector.
However, this could be a reflection of the short-term memories of the commentators, a recency bias. They’re comparing traffic from the previous months prior to the start of the Circuit Breaker. Yes, after Phase 2 there is an increase in the amount of mall traffic compared to Phase 1.
On 23 June, the weekend after entering Phase 2, a Straits Times article report an 80% increase in foot traffic at the malls. But this seemingly large number is misleading as it is comparing shopper traffic over the very low base during the Circuit Breaker period when most retailers were closed.
If you compare foot traffic year-on-year, e.g. June 2020 vs June 2019, the numbers would be abysmal. True enough, a month later, retail sales data for the full month of July 2020 published by the Department of Statistics showed a decrease of 27.8% over July 2019.
One should logically conclude that all is not well in the retail shops.

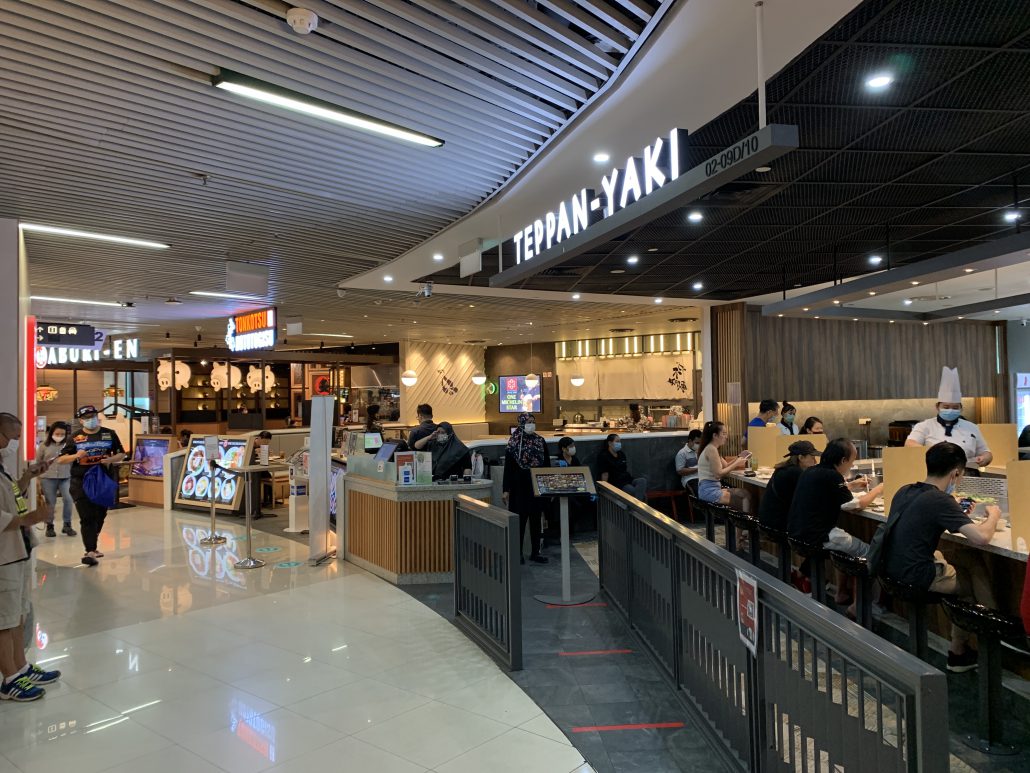
Restaurants and cafes do look full when you glance over and see the patrons waiting in queue to enter. But, with the need to adhere to safety distancing guidelines, seating capacity in these eateries are cut by up to 50%, eating into revenues.
Furthermore, Singapore had 1.8 million visitors in July 2019. In July 2020 we had 6,842. No that’s not in thousands or hundreds, we had only six thousand eight hundred and forty-two visitor arrivals.
How can the retail malls possibly be “back to normal” with that large number of foreign consumers not spending in Singapore? Let us wait for a few more months of data before we conclude whether the retail industry has really recovered to pre-COVID levels.
This leads us to the importance of site visits – we are able to get feel about the health of the retail trade before all the usual statistics are published over the following months and quarters. Reputable and competent real estate analysts put in the groundwork to visit the assets covered in their investment portfolios.
5 trends to look out for when doing a site visit to a mall
1. Foot traffic
When checking on the pulse of a mall, one begins by considering the number of visitors, or foot fall, in that mall. With insufficient visitors, tenants will not be able to sustain their rents and will eventually go out of business. This will, in turn, hurt the rental revenue of the mall operators. Foot traffic is by far the most important thing to look out for during a site visit.

Of course, there are many considerations to keep in mind while observing shopper traffic;
- Timing
You would expect a larger number of people in a mall if you visited at 12 noon as compared to 4pm because of the lunch crowd. Similarly, if you visited the malls during the weekend, you would see higher traffic and different demographics of patrons with different spending patterns as compared to a weekday crowd.
- Behavior patterns
It is also helpful to observe the behaviour of these patrons: are they in the mall just to have lunch? Or are they also patronising other non-F&B shops?
2. Are people actually spending?
Whenever you are looking at mall traffic, try to notice if the people are actually spending money in the mall. Are they holding any shopping bags or are the eateries packed? If the people are just walking around and not spending, mall tenants earn nothing.
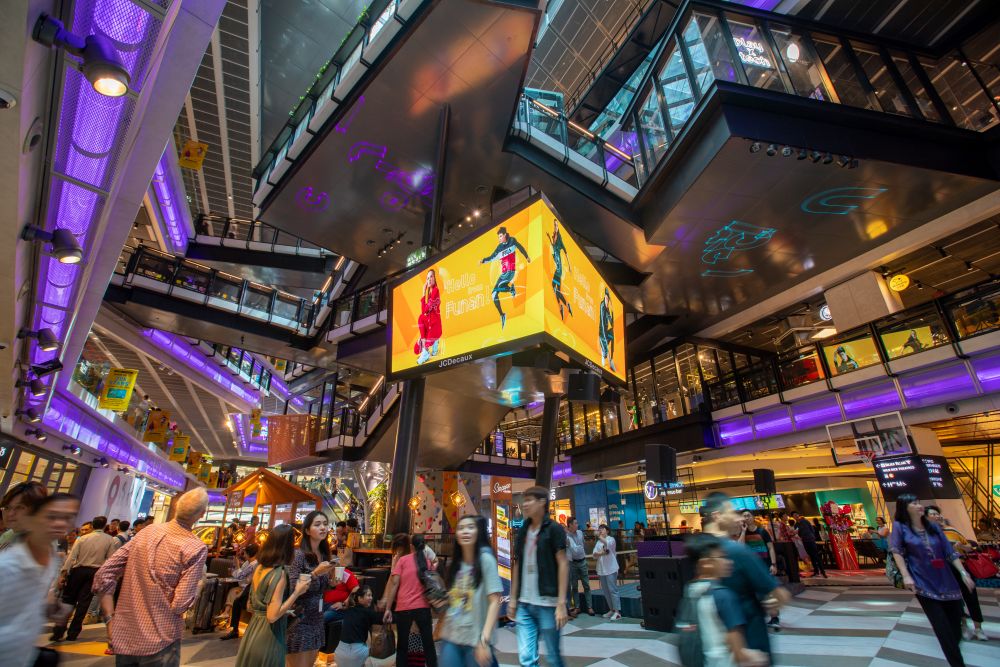
A great example of this would be the new Funan; the mall seemed to be extremely packed last year, but shop closures were still seen.
313 Somerset is another great example. 313 Somerset has very high foot traffic, but only a fraction of patrons spend in the mall. This is because the MRT station, located beneath the mall, is not well connected to other buildings in the vicinity underground. Therefore, many people will surface and pass through the mall to head for their ultimate destinations such as Winsland House, H&M and offices at The Heeren and Emerald Hill.
Thus, if you solely look at foot traffic as the key metric to gauge the health of the mall, you could be overly optimistic.
3. Demographics of shoppers
You would expect a very different crowd for Paragon at Orchard Road as compared to Northpoint at Yishun.
With different demographics, the malls have different tenant mixes and offerings to target the shoppers – Paragon is positioned at the luxury shoppers’ market while a heartland mall like Northpoint would have mid-tier brands with mass market appeal.
4. Number of shop closures

Shop closures are an important indicator of retail health. I’ll elaborate more in the next section.
If tenants had vacated their shops, it indicates that either their operations were not profitable, or that their returns were not worth the efforts.
This in turn translates to a loss of rental income during the period when the mall owner is looking for other tenants.
Thus, observing the number of recent shop closures and how long the shops have been vacant for, will allow us to gauge the health of the mall. Of course, this would need regular visits which brings us to the next point.
5. Changes in retail landscape, over time
The retail landscape is ever-changing.
To understand the health of a retail mall, a keen-eyed analyst (and investor) would compare trends over different periods:
- month on month,
- year on year,
- this Christmas season over last Christmas season,
- etc
In order to get an accurate gauge of such trends, you should aim to visit these malls at least once a month.
By being consistent, you will know how recent shop closures there are, whether there is a thinning or improvement of foot traffic, mall revamps, etc.
How to Analyse Shop Closures?
As mentioned previously, shop closures offer important clues about the health of the mall and the general consumer market. It generally means that tenants cannot afford to operate profitably.
Here’re three considerations to note:
1. Identifying shop closures
Mall owners usually hoard up these vacant shops, decorating them look like advertisements for the mall, in an effort to divert shoppers’ focus on other shops.

You’ll need to train yourself to look out for these vacant shops around the mall, snapping pictures of vacant units for future reference.
2. Read Notices on vacated shops
Notices on vacated shops will give you more details about what’s going on. It could either be:
- a notice for fitting out work, suggesting an incoming tenant.

- or for reinstatement work, suggesting that the tenant has quit.

Here are examples of some information you might get from the notices:
- Previous tenant
- Shop’s Name
- Start/End Date of the renovations
- Nature of the work: fitting out or reinstatement
3. Shop closures in high traffic areas – major warning sign
One final point about shop closures is to take note of the location where they happen.
If a shop located at a high traffic area, where traffic and business should be good is closed, it could be a worrying sign about the state of the consumer market’s health, and the mall’s health.
Here is an example:

This photo was taken in one of the busiest parts of Northpoint City, it is a high traffic area linking the MRT to the mall.
We would expect brisk business in this area, but quite a number of shops are closed. This could be an indication that the rental income of the mall might weaken.
6 factors of a successful mall
1 – Location
Location, location, location. We’ll all agree that the location of a mall determines its profitability.
But don’t over look the neighboring real estate mix. Knowing the lay of the land around the mall is important in understanding the long-term viability of the mall.
Surrounding buildings will determine a mall’s immediate market and have the biggest impact on demographics visiting the mall.
Here are some questions to ask yourself when doing your research:
- What business activities or destinations are in the vicinity to attract shopper traffic?
- Who are the competitors who will compete for shopper traffic?
- Are there residential, office or industrial buildings nearby?
- Will there be future developments that will hurt or help the property (e.g. a new office building, a new MRT station, competition from a new mall, etc)?
2 – Tenant Mix
After you have considered the mall’s location and surroundings, you will need to determine if the mall’s tenant mix is suitable for the demographics and the catchment.
For example, if there are many residential buildings nearby, the mall should cater towards the family crowd.
Case Study: Causeway Point Mall
It is important for malls to have a balanced and appropriate tenant-mix for the given characteristics and demographics of the area as it will affect the profitability of the mall.
Let’s take a look at how Causeway Point fares in terms of optimising its location and tenant mix.

These are some points of note about its surroundings:
- Woodlands Civic Centre is located next to Causeway Point. It is a “destination” with tenants like the National Regional Library, CPF Board’s service centre, tuition and enrichment centres, etc, in the building. These attract human traffic to the area, which have a spill-over effect for Causeway Point.
- Woodlands MRT station, now an interchange station of 2 lines, has a sheltered link way to the mall.
- There are many HDB blocks within 10 minutes’ walk.
- A new mixed-development Woods Square has just been built.

Woods Square has a total of 4 blocks, with 494 office units and 39 retail units ready to be occupied. Once the office units are tenanted, they will add shopper traffic for Causeway Point. However, the additional 39 retail units will also compete for tenants with Causeway Point.
Although Woods Square is expected to bring additional office workers to the Woodlands MRT area, there is a lack of pubs and bars to cater to office workers to network after office hours.
Converting some spaces around the area into watering holes might increase vibrancy of Causeway Point.
When you consider the property’s surroundings, you can get a better picture of the current and future prospects of the mall.
3 – Cohesiveness of tenants
Another consideration would be the cohesiveness of a mall’s tenants.
Strata-titled malls have a big challenge with regards getting the right tenant-mix and having tenants cooperate on marketing activities or logistics and fulfilment as compared to single-owner malls.
Shops in strata-titled malls are owned by individual owners and as such, there is less coordination and collaboration in terms of setting a theme or balancing the tenant-mix in the mall.
This could lead to an illogical and haphazard mix of tenants and trades. It may even result in attracting less desirable trades such as massage parlours, pubs and money lenders that may bring down the image of the mall and reduce the mall’s rentals and valuation. Orchard Towers is one of many examples.
4 – Good Mall Design
An interesting aspect of shopping mall design is the principle called the Gruen Transfer. It is an intentional design to make shoppers comfortable with the mall’s ambience and layout easy to familiarize, causing shoppers to want to spend more time inside the mall instead of returning to reality outside. This encourages further consumption and impulse buying.
Think of it as a kid going to Disneyland: once they step into the park, they are transported into “The Most Magical Place On Earth”.
Good mall designs are ones which psychologically “lock” consumers into the mini-ecosystem within the mall, making them forget about the outside world. The fact that most malls have very few windows is another example of the Gruen Transfer principle at work.

Good malls are also designed around the concept of circulation cores. The malls will have a layout to facilitate the movement of people around a large area of the mall.
Thus, most malls will have escalators leading to every level with a big empty space in the middle, while at the ground floor, there is usually a large event space which can draw the attention of shoppers on the higher floors.
With this in mind, you’ll want then think about:
5 – Does the Mall house “destination” tenants?
Destinations are places and amenities that attract people for specific purposes. This could be essential services like government’s service centres, banks, post office, clinics etc.
“Destinations” do not rely on “walk pass” traffic for impulse purchases.
These destinations are normally placed at obscure corners of the mall. Shoppers have to walk through large sections of the mall, potentially making purchases along the way, to get to these destinations.

A great example of this would be cinemas. If you noticed, they are always situated at the top of the malls, which generally are less desirable locations for retail tenants.
Other examples of shopping destinations include activities or attractions such as arcades, food courts, libraries and tuition centres.
6 – Asset Enhancement Initiatives
Asset Enhancement Initiatives (AEI) is a term used in real estate where landlords improve the physical condition of the property such that rentals and financial returns are increased.
This could be done in several ways:
- revamping the image,
- reconfiguring spaces, and
- upgrading common areas.
A successful AEI should increase shopper traffic for retailers and earn higher rentals for the landlords.
Causeway Point also happens to provide a great example of a well-executed AEI.
The mall owner repurposed a playground space previously located on the second level, into several F&B outlets, increasing the lettable area and the total rental income.
That said, AEIs require additional capital expenditure and suffer opportunity costs during renovations. Therefore, mall owners need to do a proper feasibility study to assess the viability of these projects.
For example, CapitaLand entirely redeveloped Funan Mall from the ground up; this took S$560 million dollars and 3 years of construction. However, the rebuilding and repositioning might not be financially rewarding as consumer adoption of e-Commerce and Covid-19 eroded retail rentals.
Careful consideration needs to be taken to understand and evaluate if these initiatives are truly worth the expenses.
Closing Thoughts on the Outlook of Singapore Retail
The future of retail looks bleak for the near future.
Two key factors contribute to my belief:
- acceleration of eCommerce adoption because of COVID-19, and
- continued oversupply of retail spaces leading to a persistently high vacancy rate.
These bearish factors will dampen retail rentals in the long term future.
So, one might ask what can be done?
It might be best to start thinking about reducing retail floor area across Singapore by repositioning them into institutional, education or healthcare uses. Some sacrifice and pain would be needed maintain the health and trust of the retail property sector.