The interesting counter is Intercontinental Exchange (ICE), the company behind the New York Stock Exchange and several other exchanges.
According to their 2017 Annual Report, Intercontinental Exchange is one of the leading global operator of regulated exchanges, clearing houses and listing venues, and a provider of data services for commodity, fixed income and equity markets. The company consists of two different business segments: (a) Trading and Clearing segment, and (b) Data and Listing services.
Their Trading and Clearing segment includes various Derivative Exchanges (one of which is ICE Futures Singapore), OTC markets, Clearing Services (one of which is ICE Clear Singapore), and Security Exchanges (New York Stock Exchange, NYSE Arca). Their Data and Listings Segment include data services which provide pricing and analytics, exchange data, and desktops and connectivity.
Backstory
First, some interesting backstory which I've come across while reading up on the company. Jeffrey Sprecher, the founder and CEO, started ICE in 2000 as an online marketplace for energy trading. Back then, one of their competitors was Enron. After the downfall of Enron, their business soared. The company struggled to handle the flood of new businesses but they eventually succeeded. In 2013, they bought over the New York Stock Exchange. Interested readers can read up about it here and here.
Disclaimer
Before I begin, there are a few things that need to be said. The subsequent analyses are based on my compilation of ICE's financials from their annual reports. The company had plenty of acquisitions and divestments across the years. Hence, the financials for a given year may appear different across two consecutive annual reports due to the enlargement of the equity base. In such cases, I made the decision to take the more recent/latest financials. As I do not know how to adjust the EPS (and other per-share metrics) for prior years following their acquisitions and divestments, my numbers may appear wonky. I have also removed data related to discontinued operations, so common sized financial statements will not tally to 100%.
Revenue
For the past 7 years, total revenue has been on an uptrend. There was a huge bump in revenue in 2014, which is probably due to the acquisition of the New York Stock Exchange. In 2017, revenue dipped by 2%.
In their Annual Reports, they breakdown revenue by their different business segments. Let us take a look at the revenue trend for each of their business segments.
First, let us take a look at their Transaction and Clearing segment. Revenue for this segment jumped in 2014 and has been hovering at the 3-billion level since then.
Next up, we have the Data Services segment. In contrast to the stagnating revenue growth for the Transaction and Clearing segment in 2016 and 2017, the Data Services segment has been growing during this same period.
The Listings segment is a new business segment that started in 2013. Revenue jumped in 2014 (probably due to accounting the full year's worth of revenue) and has been stagnant since then. Overall, the proportion of revenue contributed by the Listings segment is still pretty small compared to the other business segments.
There is also an item called "Other Revenues" in the Income Statement. As it contributes only a small portion to the overall revenue, I would not be plotting a chart for it.
Common-sizing the Income Statement shows that, as the years passed, Intercontinental Exchange is less reliant on its Transaction and Clearing business segment. Their Data Services business is playing a larger role in contributing to overall revenue.
Let us take a look at the Net Margin trend next. Net margin most probably took a hit from the acquisition of the NYSE in 2013. Following which, net margin began to creep back up.
Balance Sheet
Total assets have grown across this 7-year period. Correspondingly, total equity and total liabilities have increased as well, with the trend in total liabilities exhibiting a steeper slope than the former. Retained earnings have increased from $1.957 bil in 2011 to $6.825 bill in 2017. The amount of treasury stock has also increased from $0.644 bil in 2011 to $1.076 bil in 2017.
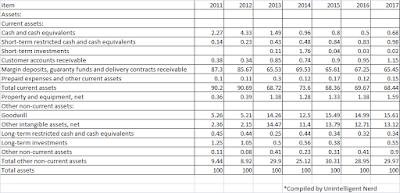
In terms of common-sized assets, cash and cash equivalents have been decreasing over the last 7 years. Margin deposits, guaranty funds and deliverable contracts receivable have decreased from 87.3% of total assets in 2011 to 65.45% of total assets in 2017. In contrast, goodwill and other intangible assets have increased over the same period.
The following is observed when the liabilities and equity portions of the Balance sheet is common-sized. The proportion of total liabilities to total assets fell from 0.91 in 2011 to 0.78 in 2017 while the proportion of total equity to total assets increased from 0.08 in 2011 to 0.21 in 2017.
Cash Flow Statement
Cash flow from operations have been positive. Similarly, free cash flow has been positive as well.
Dividend Trend
The above chart illustrates Intercontinental Exchange's Dividend History on a per-share basis. There are a few things to note regarding the above chart. First, Intercontinental Exchange started distributing dividends in 2013. Second, yahoo finance dividend data contains errors. This is not the first time that I managed to spot such errors. For example, they double-counted one of the distributions in 2016. Hence, the bar for 2016 looks much more taller than it actually is. Third, as mentioned in the beginning of this article, there have been plenty of acquisitions and divestments done by the company. As a result, their metrics from a per-chase basis has been adjusted quite often and, as I lack the necessary data/expertise to re-adjust them, they will appear wonky. If you look at the official sources, ICE has been growing their dividends for shareholders. However, my chart is not able to capture that.
GFC Performance
When the share price goes south, dividends help income investors to stay the course. As mentioned above, in the case of ICE, they started distributing dividends in 2013. Prior to that, investors had only capital gains to rely on. This was especially painful when the GFC occurred, with ICE losing around 67% of its market value.
That's all folks. Thanks for reading!
Not vested in Intercontinental Exchange


Hi unN,
ReplyDeleteFor intercontinental exchange, comparing your data analytical findings to morningstar data, will you be able to discern whether morningstar financial data is accurate?
I am unfamiliar with US GAAP accounting and acquisition heavy companies as its financials can be heavily distorted. Look forward to your feedback!
Hi INTJ,
DeleteI can't really tell. There have been plenty of acquisitions and divestments done by Intercontinental Exchange, with the accompanying changes in capital structure.
For an outsider like myself, coupled with my limited fundamental analysis skills, take my analysis in this case with a pinch of salt.
Cheers!