The key difference between XLF and VFH is their level of diversification. XLF gives you exposure to the largest stocks in the Financials sector while VFH gives you exposure to a portfolio of large, mid and small cap finance stocks. At the point of writing, the XLF has only 72 holdings while the VFH has 372 holdings.
Another interesting difference is that XLF’s portfolio has about 25% exposure to banks while VFH has about 32% exposure to banks. This might be something to note if you are worried about getting too much exposure to banks due to the recent banking crisis.
We explore the differences between XLF and VFH, as well as the implications they would have on your investment decisions in this article.
XLF vs VFH
| XLF | VFH | |
|---|---|---|
| Name | Financial Select Sector SPDR Fund | Vanguard Financials Index Fund ETF |
| Expense Ratio | 0.1% | 0.1% |
| AUM | $30B | $7.65B |
| No. of holdings | 72 | 372 |
| Fund Manager | State Street Global Advisors | Vanguard |
| What edge does this financials ETF offer? | The oldest financials ETF that gives you exposure to a balanced portfolio focusing on the Financial sector in the U.S. | Provides wider diversification within the Financial sector in the U.S. |
XLF vs VFH: Underlying Indices
XLF tracks the Financial Select Sector Index while the VFH tracks the MSCI USA IMI Financials 25/50 Index.
Although both indices follow the performances of listed U.S. companies within the financials sector, there are subtle differences that would affect the level of diversification when they are translated into an ETF.
The Financial Select Sector Index is maintained by S&P Global. It classifies all the stocks within the S&P 500 based on the Global Industry Classification Standard. Only those that are classified as Financials will make it into the Financial Select Sector Index.
In simple terms, the Financial Select Sector Index gives you exposure to Financials stocks chosen from 500 of the largest companies listed on U.S. stock exchanges.
The MSCI USA IMI Financials 25/50 Index is maintained by MSCI and includes large, mid and small cap stocks.
This affects the eventual diversification provided by XLF and VFH ETFs:
XLF vs VFH: Diversification
As mentioned above, XLF gives you exposure to the largest stocks in the Financials sector while VFH gives you exposure to a portfolio of large, mid and small cap finance stocks.
The most direct indication of portfolio diversification is often the number of stocks in a portfolio. At the point of writing, the XLF has only 72 holdings while the VFH has 372 holdings.
To get a better idea of the level of diversification offered by XLF and VFH, let’s take a closer look at:
XLF vs VFH: Sub sector exposure
At the point of writing, here’s XLF’s sector breakdown:

| Sector | Weight |
| Financial Services | 33.22% |
| Banks | 24.65% |
| Capital Markets | 21.59% |
| Insurance | 16.38% |
| Consumer Finance | 4.16% |
Comparatively, VFH breaks its portfolio into 15 subsectors:
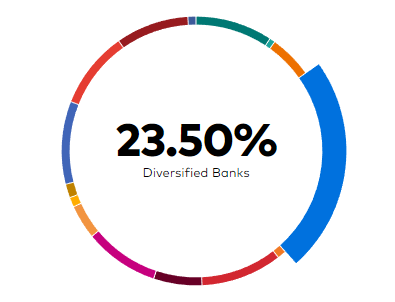
| Sector | Weight |
| Diversified Banks | 23.5% |
| Multi-Sector Holdings | 10% |
| Financial Exchanges & Data | 9.8% |
| Asset Management & Custody Banks | 9.3% |
| Property & Casualty Insurance | 9.3% |
| Investment Banking & Brokerage | 9% |
| Regional Banks | 8.8% |
| Insurance Brokers | 5.8% |
| Consumer Finance | 5.2% |
| Life & Health Insurance | 4.1% |
| Multi-line Insurance | 1.6 |
| Mortgage REITs | 1.1 |
| Diversified Financial Services | 1 |
| Reinsurance | 0.9 |
| Commercial & Residential Mortgage Finance | 0.6 |
It could be a case where XLF’s sector breakdown uses a more flexible criteria leading to lesser sectors.
Looking at the breakdown provided above, you would have noticed that XLF’s portfolio has about 25% exposure to banks while VFH has about 32% exposure to banks.
As mentioned in the introduction, you might want to note this if you are worried about getting too much exposure to banks due to the recent banking crisis.
XLF vs VFH: Volatility
In general, larger stocks tend to be less volatile than stocks with smaller market cap. Hence, it is natural that XLF ETF experiences lower volatility as compared to VFH.
Here’s a comparison of their annualized standard deviation over different periods:
| ETF | Ticker | 3 year | 5 year | 10 year |
| Financial Select Sector SPDR ETF | XLF | 22.06% | 23.26% | 18.63% |
| Vanguard Financials ETF | VFH | 22.17% | 23.81% | 18.55% |
You would also want to note that over the past 10 years, XLF’s maximum drawdown was -31.75% while VFH’s maximum drawdown was -33.1%.
Looking at their volatility data, although VFH is slightly more volatile, the difference is not too big. This boils down to their actual holdings. Let’s take a closer look at their top 10 holdings to find out why:
XLF vs VFH: Top 10 holdings
Let’s compare the top 10 holdings of XLF and VFH here to find out how much their portfolios overlap.
The top 10 holdings of XLF makes up 54.99% of its total portfolio while the top 10 holdings of VFH makes up 42.79% of its total portfolio.
| XLF Top 10 Holdings | VFH Top 10 Holdings | |||||
|---|---|---|---|---|---|---|
| Company | Ticker | Weight | Company | Ticker | % of fund | |
| Berkshire Hathaway Inc. Class B | BRK.B | 13.26% | Berkshire Hathaway Inc. Class B | BRK.B | 9.94 % | |
| JPMorgan Chase & Co. | JPM | 9.04% | JPMorgan Chase & Co. | JPM | 9.42 % | |
| VISA | V | 7.94% | Bank of America | BAC | 4.91 % | |
| MASTERCARD | MA | 6.79% | Wells Fargo & Co. | WFC | 3.52 % | |
| Bank of America | BAC | 4.47% | S&P Global | SPGI | 2.81 % | |
| Wells Fargo & Co. | WFC | 3.54% | Goldman Sachs Group | GS | 2.70 % | |
| S&P Global | SPGI | 2.76% | Morgan Stanley | MS | 2.65 % | |
| Goldman Sachs Group | GS | 2.49% | American Express | AXP | 2.38 % | |
| Morgan Stanley | MS | 2.47% | BlackRock | BLK | 2.34 % | |
| BlackRock | BLK | 2.23% | Citigroup | C | 2.12 % |
XLF and VFH hold 8 of the same stocks in their top 10 holdings, which suggests that the key differences in their portfolio could be in the low weightage mid and small cap stocks. This could be why their volatility does not differ too much in reality.
XLF vs VFH: Historical Performance
After diving into the different aspects of XLF and VFH, let’s take a look at what’s really important for investors like us; XLF and VFH’s performance.
Here’s their performance over the past 10 years:
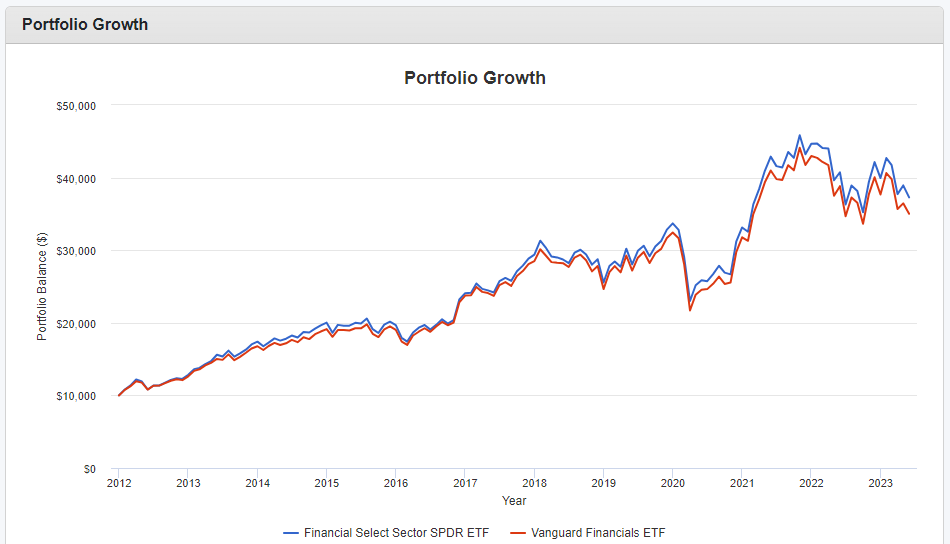
And if you’re thinking of investing in either XLF or VFH over a longer term, here’s their performance since 2005 (given that VFH was only incepted in 2004):

While stocks with larger market cap are known to offer lower volatility, they are also known to deliver lesser returns in the long run (read more about the Size factor in investing here).
VFH’s outperformance over the XLF in the longer duration is an example of the size factor in action.
XLF vs VFH: Which should you choose?
If you’re looking to buy and hold a financials ETF over the long term, VFH might be able to offer greater returns if given a long enough runway. VFH also offers more diversification as compared to XLF ETF.
However, on the flip side, VFH would tend to be more volatile than XLF. If you’re not comfortable with the fluctuations, go with XLF. Or better yet, just go with a cheaper broad based index ETF like the S&P 500 ETF.
If you’re looking for more Financials or Bank ETFs options, read my compilation of the Best Bank ETFs here.