The Global Wealth Report explores how wealth is created, how it varies across regions globally, and how it transforms across generations.
For the first time, the 2023 edition is produced jointly by Credit Suisse and UBS.
The 2023 report covers the estimated wealth holdings of 5.4 billion adults around the world, based on 2022 data.
The Global Wealth Report reveals valuable insights about the economy and global household wealth.
Let’s explore 5 key takeways – including data on Singapore millionaires – read on below!
This article was written by a Financial Horse Contributor, with reference to the Global Wealth Report.
1. Who wants to be a millionaire?
According to the Global Wealth Report’s projections, global wealth will rise by 38% over the next five years.
This means that global wealth is projected to reach USD 629 trillion by 2027.
Growth by middle-income countries will be the primary driver of global trends.
Wealth per adult is estimated to reach USD 110,270 in 2027.
It is also estimated that the number of millionaires will reach 86 million while the number of ultra-high-net-worth individuals (UHNWIs) is likely to rise to 372,000 individuals.

2. Average wealth per adult
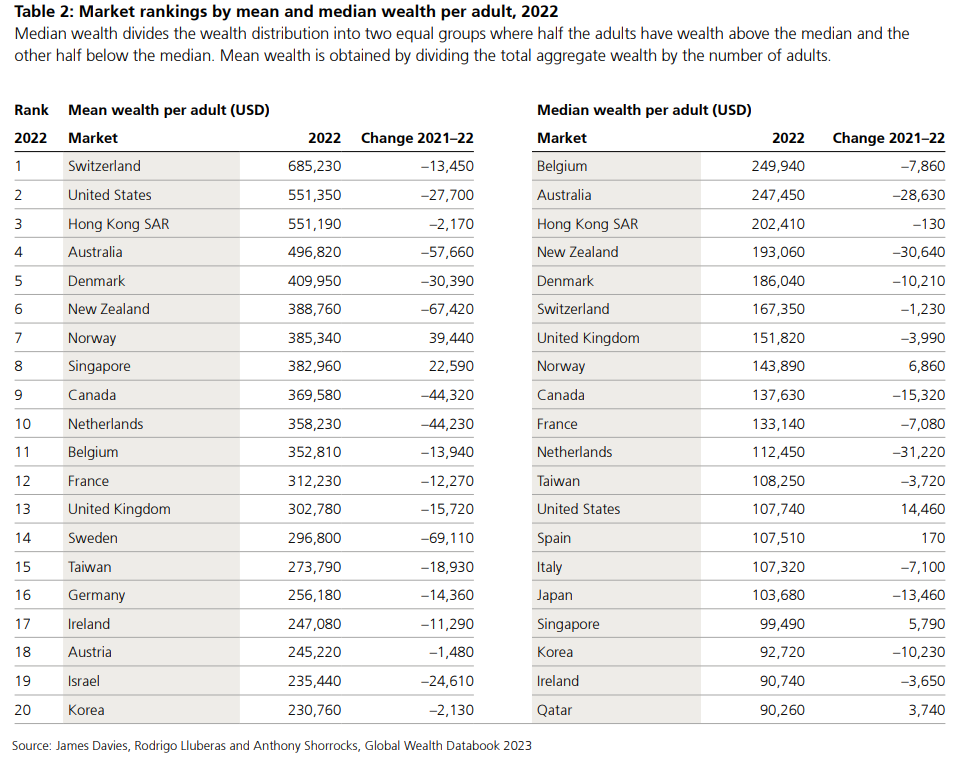
Table 2 shows the top ranking markets by mean and median wealth among the 60 markets with the highest total wealth.
Within this group – which excludes smaller countries like Liechtenstein and Monaco – Switzerland again tops the list with wealth per adult of USD 685,230.
The United States (USD 551,350) is in second place, fractionally above Hong Kong SAR (USD 551,190) and ahead of Australia (USD 496,820).
There is then a substantial gap before a cluster of countries appears (Denmark, New Zealand, Norway, Singapore, Canada, the Netherlands and Belgium) all with wealth per adult between USD 350,000 and USD 410,000.
Most of this top group experienced often sizeable reductions in mean wealth. The exceptions were Norway, which gained USD 39,440 per adult and five places in the ranking, and Singapore, which gained USD 22,590 and three places.
BTW – we share commentary on Singapore Investments every week, so do join our Telegram Channel (or Telegram Group), Facebook and Instagram to stay up to date!
I also share great tips on Twitter.
Don’t forget to sign up for our free weekly newsletter too!
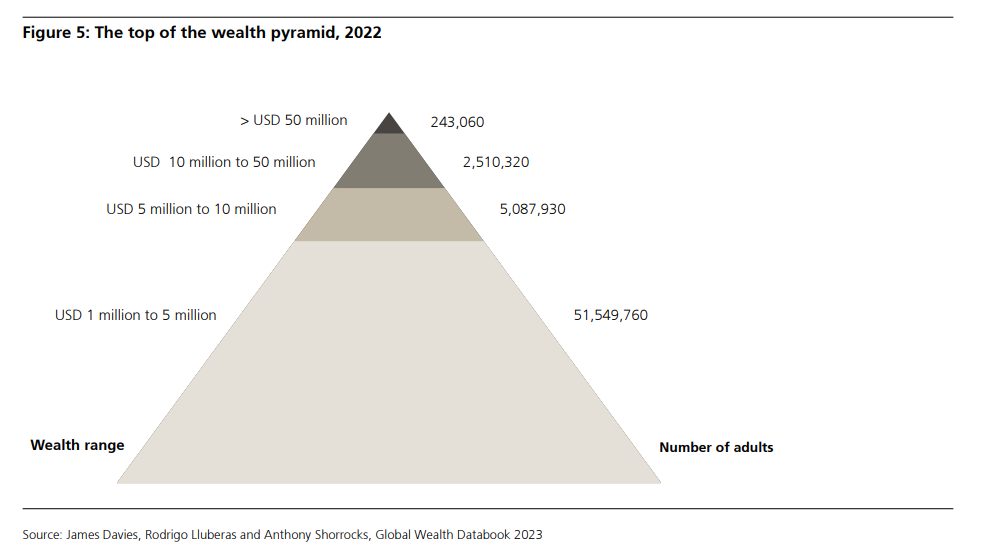
3. Global wealth distribution
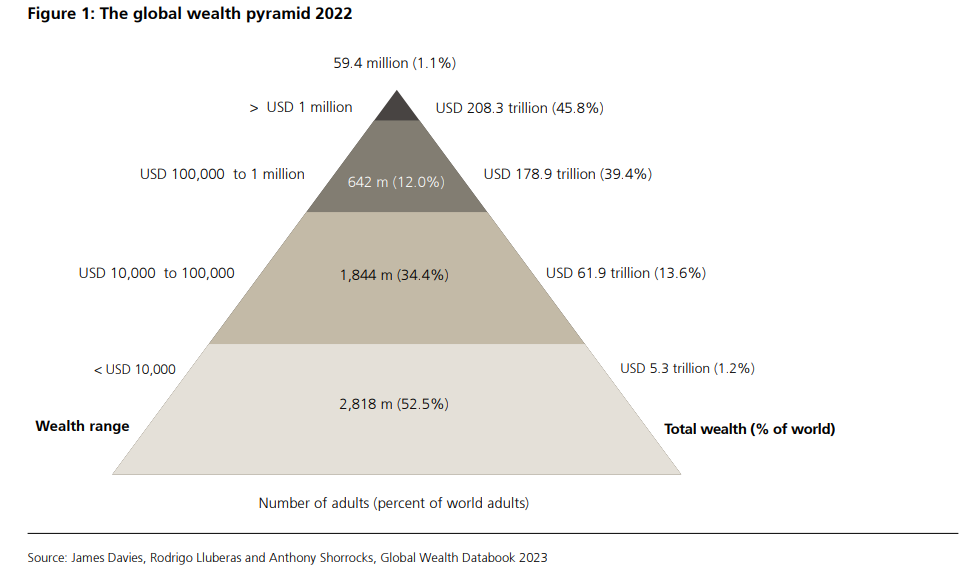
The wealth pyramid in Figure 1 summarizes the distribution of wealth among adults worldwide.
It is estimated that 2.8 billion individuals – 53% of all adults in the world – had wealth below USD 10,000 in 2022.
The next segment, covering those with wealth in the range of USD 10,000–100,000, has seen the biggest rise in numbers this century, more than trebling in size from 503 million in 2000 to 1.8 billion in mid-2022.
This reflects the growing prosperity of emerging economies, especially China, and the expansion of the middle class in the developing world.
The average wealth of this group is USD 33,573 or about 40% of the level of average wealth worldwide.
Total assets of USD 61.9 trillion provide this segment with considerable economic leverage.
The upper-middle segment, with wealth ranging from USD 100,000 to USD 1 million, has also trebled in size this century from 208 million to 642 million people.
Members of this group currently own net assets totaling USD 178.9 trillion or 39.4% of global wealth, which is over three times their percentage share of the adult population.
The wealth middle class in developed nations typically belongs to this group.
Above them, the top tier of high-net-worth (HNW) individuals (i.e. US dollar millionaires) remains relatively small in size, numbering 59.4 million or 1.1% of all adults.
The number of global millionaires has been growing rapidly in recent years and exceeded 1% of adults for the first time in 2020.
In terms of wealth ownership, the HNW group is increasingly dominant. The aggregate wealth of HNWs has grown five-fold from USD 41.4 trillion in 2000 to USD 208.3 trillion in 2022, and their share of global wealth has risen from 35% to 46% over the same period.
4. High Net Worth Individuals
High Net Worth individuals
HNW individuals are heavily concentrated in particular regions and countries, and tend to share similar lifestyles – participating in the same global markets for luxury goods, vacations and education opportunities for their children, for example, even when they reside in different continents.
The wealth portfolios of these individuals are also likely to be more similar, with a focus on financial assets and particularly equities, bonds and other securities traded in international markets.
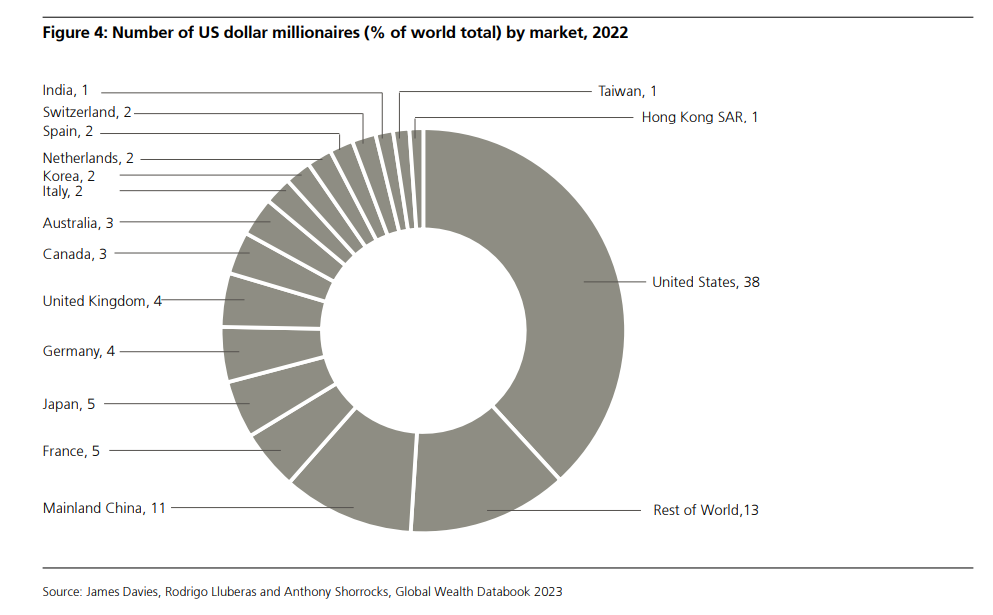
The United States has by far the greatest number of millionaires at 22.7 million or 38.2% of the world total.
This is far ahead of China in second place, with 10.5% of all global millionaires.
Millionaire numbers in Japan vied with the United States at the turn of this century, but Japan’s position has steadily eroded since then. Japan was overtaken by China in 2014 and accounted for just 4.6% of millionaires in 2022, putting it for the first time in fourth place below France (4.8%) and challenged by Germany (4.4%) and the United Kingdom (4.3%).
Next come Canada (3.4%) and Australia (3.1%), followed by Italy, Korea, the Netherlands, Spain and Switzerland, each hosting about 2% of global millionaires. India, Taiwan and Hong Kong SAR also account for more than 1% of the world’s dollar millionaires, but that is no longer true of Sweden this year.
Worldwide, it is estimated that there were 59.4 million millionaires at the end of 2022.
Inflation millionaires
There are four times as many US dollar millionaires in the world as there were at the turn of the century.
Several factors help account for this rise. Adult populations have been growing in most countries and real household wealth has increased by 150% since 2000. But inflation has also speeded up the process by progressively reducing the real threshold for membership of the dollar millionaire group.
For the world as a whole, there were 4,395,400 “inflation millionaires” – adults who qualified as millionaires for the purpose of Figure 4, but who would not have qualified if the real 2021 standard was applied instead.
Ultra high net worth individuals
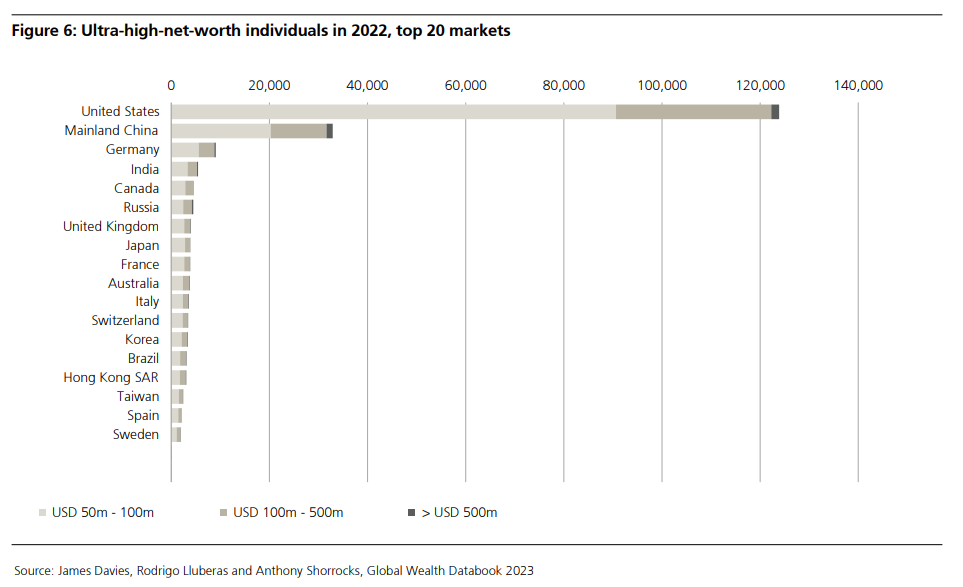
79,490 adults had wealth above USD 100 million at the end of 2022, of which 7,020 are worth more than USD 500 million.
The regional breakdown of the UHNW group as a whole is dominated by North America with 128,470 members (53%), while 40,090 (17%) live in Europe, 32,910 (14%) in Mainland China and 27,700 (11%) in Asia-Pacific countries, excluding China and India.
5. Singapore millionaires
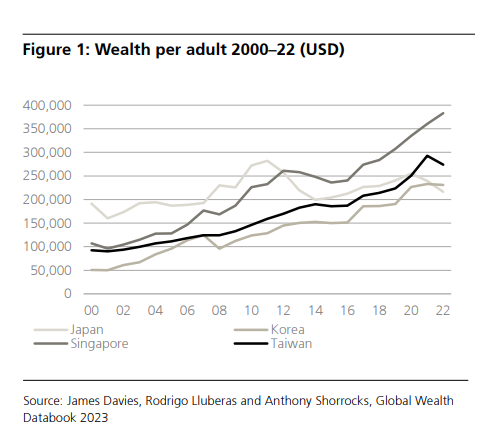
At the end of 2022, wealth per adult was USD 216,078 in Japan, USD 230,760 in Korea, USD 273,788 in Taiwan and USD 382,957 in Singapore.
Since the year 2000, wealth per adult in US dollars has grown at an average annual rate of 4.7% in these markets.
The fastest wealth growth has been seen in Singapore and Korea, with rates of 6.0% and 7.2%, respectively, followed by Taiwan at 5.1% and Japan at just 0.6%.
Overall, growth has been skewed toward financial assets, which, on a per adult basis, rose at an average rate of 5.1% across the four markets, compared with 3.8% for non-financial assets.
Debt per adult rose at an average annual rate of 3.7%.
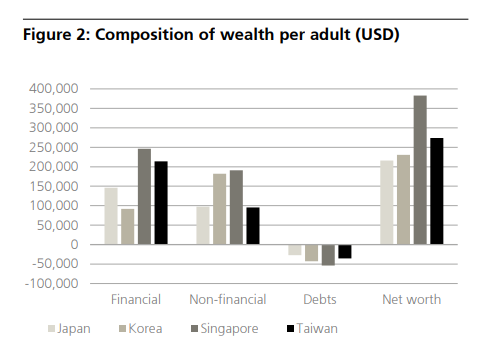
Financial assets accounted for over half of personal wealth in Japan, Singapore and Taiwan at the end of 2022, ranging from 56.3% of gross assets in Singapore to 69.1% in Taiwan.
The situation differs in Korea, where non-financial assets contributed 66.5% of total household assets.
Over the years, the importance of financial assets has risen in each of the markets. On average, they made up 48.1% of gross assets in the year 2000, but 54.7% in 2022.
Household debt, on the other hand, has fallen slightly compared with assets. The ratio of debt to gross assets was 16.3% in the year 2000 and fell gradually to 12.7% by 2022.
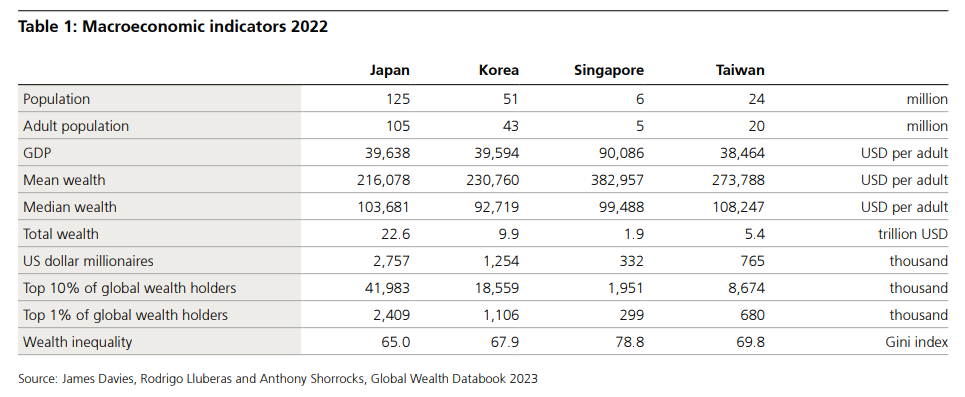
Wealth inequality is relatively low by international standards in Japan, Korea and Taiwan, as reflected in wealth Gini coefficients of 65.0, 67.9 and 69.8, respectively. The wealth shares of top groups are similarly low, with a top 1% share of 18.9% in Japan, 22.3% in Korea and 26.0% in Taiwan.
This low level of wealth inequality partly reflects the comparatively low level of income inequality in these markets, but owes something as well to a pro-saving culture spread across all income levels.
Relatively heavy inheritance taxes in Korea and Japan have also no doubt had an impact.
Singapore has higher wealth inequality.
Its wealth Gini, at 78.8, is much higher than in the other three markets, as is the wealth share of the top 1%, which was 34.1% at the end of 2022.
2023 Global Wealth Report Projections
- Global wealth is expected to rise by 38% over the next five years, reaching USD 629 trillion by 2027.
- Growth by middle-income countries will be the primary driver of global trends.
- The authors estimate wealth per adult to reach USD 110,270 in 2027 and the number of millionaires to reach 86 million while the number of ultra-high-net-worth individuals (UHNWIs) is likely to rise to 372,000 individuals.
OCBC Online Equities Account – Trade on 15 global exchanges, all via the OCBC Digital Banking App!
Did you know that can you trade shares on your OCBC Digital Banking App?
With an OCBC online equities account, you can buy stocks, local ETFs, REITs, bonds and more directly through your banking app.
Everything on one app! Fuss-free funding, with access to 15 global exchanges
For SGD trades, you can fund and settle automatically via your OCBC account.
And for FX trades, you can settle using the foreign currency held in your OCBC Global Savings Account.
This means fuss-free trade settlement and minimising forex costs – saving you time and money.
Start trading with your OCBC Online Equities Account here!
Trust Bank Account (Partnership between Standard Chartered and NTUC)
Sign up for a Trust Bank Account and get:
- $35 NTUC voucher
- 1.5% base interest on your first $75,000 (up to 2.5%)
- Whole bunch of freebies
Fully SDIC insured as well.
It’s worth it in my view, a lot of freebies for very little effort.
Full review here, or use Promo Code N0D61KGY when you sign up to get the vouchers!
Investment Research Tools
I use Trading View for my research and charts. Get $15 off via the FH affiliate link.
I also use Koyfin for fundamental and macro research. Get a 10% discount via the FH affiliate link.
Portfolio tracker to track your Singapore dividend stocks?
I use StocksCafe to track my portfolio and dividend stocks. Check out my full review on StocksCafe.
Low cost broker to buy US, China or Singapore stocks?
Get a free stock and commission free trading Webull.
Get a free stock and commission free trading with MooMoo.
Get a free stock and commission free trading with Tiger Brokers.
Special account opening bonus for Saxo Brokers too (drop email to [email protected] for full steps).
Or Interactive Brokers for competitive FX and commissions.
Best investment books to improve as an investor?
Check out my personal recommendations for a reading list here.