As we close off FY2021 and kick start FY2022, investors are now wary that our 3 local banks are grossly overvalued and due for a correction soon. With our 3 local banks, DBS (SGX: D05), UOB (SGX: U11), and OCBC (SGX: O39) just released their FY2021 results, as well as announcing a net increase in dividend payout, many investors are wondering if they are too overvalued at this point or is there still more upside to go? In this article, I will go cover the FY2021 results of our 3 local banks as well as discuss if they are still a great investment at their current valuation.
Operating Performance
| Year on Year Difference | Revenue | Profit Before Allowances | Allowances Made | Net Profit |
|---|---|---|---|---|
| DBS | S$14.297 billion (-2%) | S$7.828 billion (-7%) | S$52 million (-98%) | S$6.801 billion (+44%) |
| UOB | S$9.789 billion (+7%) | S$5.594 billion (+10%) | S$657 million (-58%) | S$4.075 billion (+40%) |
| OCBC | S$10.596 billion (+5%) | S$6.656 billion (+5%) | S$855 million (-28%) | S$4.858 billion (+35%) |
Starting off with the operating performance of the 3 local banks, we can see that UOB is taking the lead with a 7% growth in revenue and 10% growth in profit before allowances. OCBC trails behind slightly at 5% and 5% respectively while DBS actually saw its overall performance slowdown from the year prior, having its revenue fall by 2% and profit before allowances by 7%. The drop in DBS’s revenue and profit before allowances is actually due to the 17bp decline in Net Interest Margin year over year.
As expected, all 3 banks continue to lower their allowances made and in turn, results in a huge jump in net profits. DBS as expected, takes the lead, growing its net profit by a huge margin of 44%, followed by UOB at 40% and OCBC at 35%. It is good to note that DBS’s allowances made for FY2021 are significantly lower than UOB and OCBC at only S$52m, a 98% reduction year over year whereas its peers only reduced their allowances made by 58% and 28% respectively. This could imply that either DBS is very confident moving forward or its peers are being extra conservative with their allowances made.
Key Financial Ratios
| As at 31 December 2021 | Net Interest Margin | Cost/Income Ratio | Non-Performing Loans Ratio | Liquidity Coverage Ratios (LCR) | Leverage Ratio | Common Equity Tier 1 |
|---|---|---|---|---|---|---|
| DBS | 1.45% | 45% | 1.3% | 135% | 6.7% | 14.4% |
| UOB | 1.56% | 44.1% | 1.6% | 135% | 7.2% | 13.5% |
| OCBC | 1.54% | 45% | 1.5% | 151% | 7.7% | 15.5% |
Moving onto key financial ratios, and as I’ve mentioned before, is definitely the most important part when analyzing and evaluating a bank. At first glance, UOB seems to be beating its peers with the highest NIM at 1.56%, a slight drop from last year’s 1.57%. As for its peers, DBS has the lowest NIM at 1.45%, falling from a high of 1.62% YoY whereas OCBC trails behind UOB closely with a NIM of 1.54%, falling from a high of 1.61% YoY.
Next, we will look at the Cost/Income ratio which UOB is leading as well at 44.1% as compared to 45.6% a year ago whereas DBS and OCBC trail behind at 45%. Just to recap, the Cost/Income ratio is used to see how well the company is managing its costs and spending to generate revenue. In essence, a low Cost/Income ratio signifies that the company is managing its costs well and is not overspending to generate revenue.
The LCR and NPL ratio seems to be rather consistent across the 3 local banks with OCBC taking a huge lead in terms of LCR, standing at a strong 151% while UOB and DBS’s LCR stand at 135%. In addition, OCBC has the highest leverage ratio at 7.7% and the strongest CET-1 ratio at 15.5%. DBS’s leverage ratio is the lowest amongst the 3 local banks at 6.7% with UOB trailing ahead at 7.2%. DBS edges UOB out with a CET-1 ratio of 14.4%, beating UOB’s 13.5%.
Based on the financial ratios, we can definitely see that OCBC has performed the best with the strongest balance sheet, second-highest NIM, and efficient cost/income ratio.
Valuation
| Annualized PE Ratio | PB Ratio | Dividend Yield | Return on Equity | |
|---|---|---|---|---|
| DBS @ $33.82 | $2.61 (12.96) | $21.47 (1.58x) | 4.26% ($1.44) | 12.5% vs 9.1% yoy |
| UOB @ $29.91 | $2.39 (12.51x) | $27.16 (1.10x) | 4.01% ($1.20) | 10.2% vs 7.4% yoy |
| OCBC @ $11.67 | $1.07 (10.91x) | $11.46 (1.02x) | 4.54% ($0.53) | 9.6% vs 7.6% yoy |
Based on the last closing price of the 3 banks, we can see that OCBC is the cheapest in terms of valuation as compared to its peers whereas DBS is the most expensive bank in terms of valuation. At the last closing price, DBS is valued at a 12.96x PE with a PB of 1.58x. UOB trails behind closely with a PE of 12.51x and a much lower PB ratio of 1.10x. OCBC comes last with a PE of 10.91x and a PB ratio of only 1.02x. When comparing the annualized forward dividend yield, OCBC has the highest yield at 4.54% with DBS coming in second with a yield of 4.26% and UOB following close behind in 3rd place at 4.01%.
Another good metric to valuate these banks would be using ROE or ROCE. Return on equity (ROE), also known as return on common equity (ROCE), is a measure of a business’s profitability. Specifically, it is a ratio describing the rate of profit growth a business generates for shareholders and owners. DBS has the strongest ROE at 12.5%, growing from 9.1% YoY. UOB comes second at 10.2% as compared to a year ago at 7.4%. OCBC comes last with an ROE of 9.6% as compared to a year ago at 7.6%.
Potential Growth Catalysts
With the 3 local banks consistently breaking new highs over the past year, are there any more potential growth catalysts for them to grow over the next 12 months?
Acquisition of Citi Assets
In January 2022, Citigroup announced that they are selling its consumer business across 4 key Southeast Asian markets (Indonesia, Malaysia, Thailand, and Vietnam) to UOB for approximately S$5B. The acquisition doubles UOB’s retail customer base across the four markets. The acquisition is expected to accelerate growth and deepen UOB’s regional franchise.
Citigroup’s consumer business has an aggregate NAV of S$4.0b and generated an income of S$0.5b in 1H21 alone. Excluding one-off transaction costs, the acquisition is expected to be immediately accretive to UOB’s EPS and ROE. Including one-off transaction costs, the acquisition is expected to be accretive to EPS and ROE by 2023. The management targets to improve ROE to above 13% and Return on risk-weighted assets (RORWA) by 30bp to 2.0% by 2026, driven by scaling up regional subsidiaries and organic growth.
The total cash consideration for the acquisition of about S$5b, is calculated based on an aggregate premium of S$915m, plus the NAV of the consumer business at completion, representing P/B at 1.2x. The acquisition is expected to be financed through excess capital and reduce CET-1 CAR by 70bp to 12.8%. CET-1 CAR is expected to recover back above 13% by 2023.
Similarly, during the same timeframe, Citigroup has also announced the sale of its Taiwan assets to DBS. The deal will be done via a transfer of assets and liabilities, and DBS will pay Citigroup cash for the net assets of their book, plus an additional premium of approximately ~S$956m. In addition, it is injecting an additional ~S$1.2bn of capital to support incremental RWA. The cumulative pricing of approximately ~1.8x PB is not cheap, but the deal is meaningfully synergistic to DBS’s Greater China strategy (14% of loans). When compared to other Taiwan banks, the deal is made at approximately 9x PE which isn’t expensive in comparison.
As a result, credit card loans are set to increase by 4.7x and AUM by 3.5x in Taiwan. Citi’s business serves a more affluent client segment (20% higher credit card spend than DBS, 50% higher balance for premier clients). As such, significant cross-selling opportunities could open for the combined entity. Concurrently, low-cost CASA is rising from 39% to 53% giving DBS a significant funding advantage in their institutional banking business. which accounted for 69% of loans pre-deal.
The acquisition of Citigroup assets for both UOB and DBS will be fantastic over the long term as it allows them to grow at an accelerated pace in the Southeast Asian market. Investors can expect a much stronger FY2022 once these acquisitions are completed during the year.
Interest Rate Hikes in FY2022 & FY2023
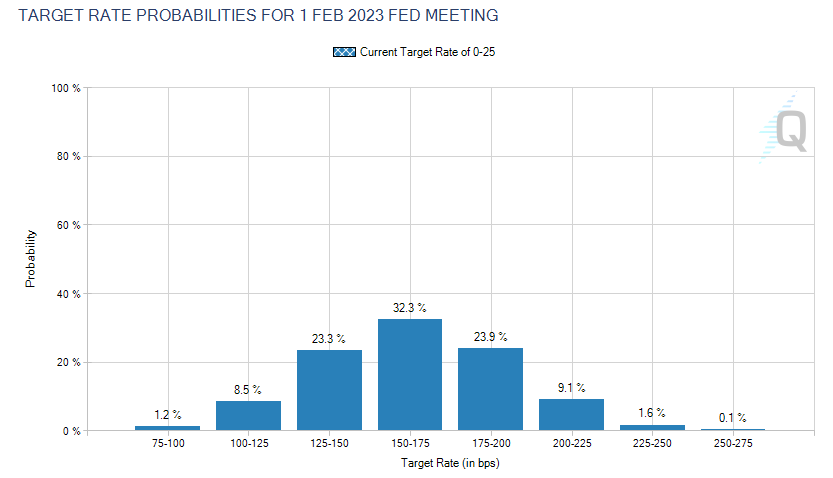
Another key catalyst for the 3 local banks would be the inevitable interest rate hikes coming in FY2022 as well as FY2023. Most of the market analysts expect at least 4 hikes each in 2022 and 2023, with each hike increasing the interest rate by 25bps. This will mean that we will reach an approximate 2% interest rate by the end of FY2023. We all understand that the increase in interest rate will impact the banks but in what way exactly?
When interest rates are higher, banks can make more money either by charging higher interest on loans or by taking advantage of the difference between the interest banks pay to customers and the interest the bank can earn by investing. At times, a bank might pay its customers a full percentage point less than it earns through investing in short-term interest rates. As such, we will need to understand what is the CASA ratio for a bank.
In short, the CASA ratio stands for the “current and savings account” ratio. The CASA ratio of a bank is the ratio of deposits in current and saving accounts to total deposits. A higher CASA ratio indicates a lower cost of funds because banks usually give a much lower interest rate on current and savings accounts. Indirectly, a higher CASA ratio will translate to a higher net interest margin as well for banks.
For DBS, with a higher CASA ratio of 76%, the management has guided an estimated positive impact to net interest income at S$18-20m for every 1bp increase in US interest rates. Management’s base case assumption is four rate hikes of 25bp each in FY2022 (one hike per quarter), translating to an additional total income of S$1.8B-S$2B with full impact in FY2023. The NIM is also expected to grow to 1.61% (+15bp) in 2022 and 1.74% (+13bp).
For UOB, with a moderate CASA ratio of 53.5%, the management has also guided an estimated positive impact to net interest income at S$6m-8m for every 1bp increase in US interest rates. Based on the same base case assumption, we can expect UOB to make an additional S$1.2B-S$1.6B in net interest income up to FY2023.
For OCBC, with a much stronger CASA ratio of 63.3%, the management has guided an estimated positive impact to net interest margins by 18bp for every 100bp increase in local interest rates, which could add an additional ~S$670m to its net interest income. Using the same base case assumption, we can expect OCBC to make an additional ~S$1.34B in net interest income up to FY2023. The NIM is guided to remain stable at 1.50%-1.55% in FY2022.
Final Thoughts
In summary, all 3 banks performed remarkably in FY2021, being able to continuously grow their business amidst the pandemic situation. Among the 3 local banks, we can see that OCBC has done the best with the strongest balance sheet, second-highest NIM as well as efficient cost/income ratio. Despite OCBC having the lowest growth in net profit YoY, we need to account for the fact that they made a lot of allowances (~S$855m), which only represents a 28% drop YoY as compared to its peers which reduced their allowances made significantly. When we talk about valuation, OCBC is also the cheapest with a PE of only 10.91x, PB of only 1.02x, and a forward annualized yield of 4.54%, which is higher than our risk-free rate in Singapore (CPF SA – 4%).
As we welcome the inevitable waves of interest rate hikes across FY2022 and FY2023, we can definitely expect the 3 local banks to continue to do well. Being well-capitalized, coupled with such strong growth catalysts and an increasing dividend payout YoY, it won’t be a surprise to see DBS cross $40, UOB cross $35, and OCBC cross $15 all within FY2022 itself.
Pingback: Are Our Local Banks Undervalued? How Have DBS, UOB, and OCBC Performed In FY2023 Thus Far?
Pingback: 4 Alternate Investments That Might Yield You Higher Returns Than The Current Risk-Free Interest Rates - sgstockmarketinvestor