With a blink of the eye, half of 2022 is over. We think its a good time to take a pause and review how the markets performed thus far, especially in such difficult market conditions.
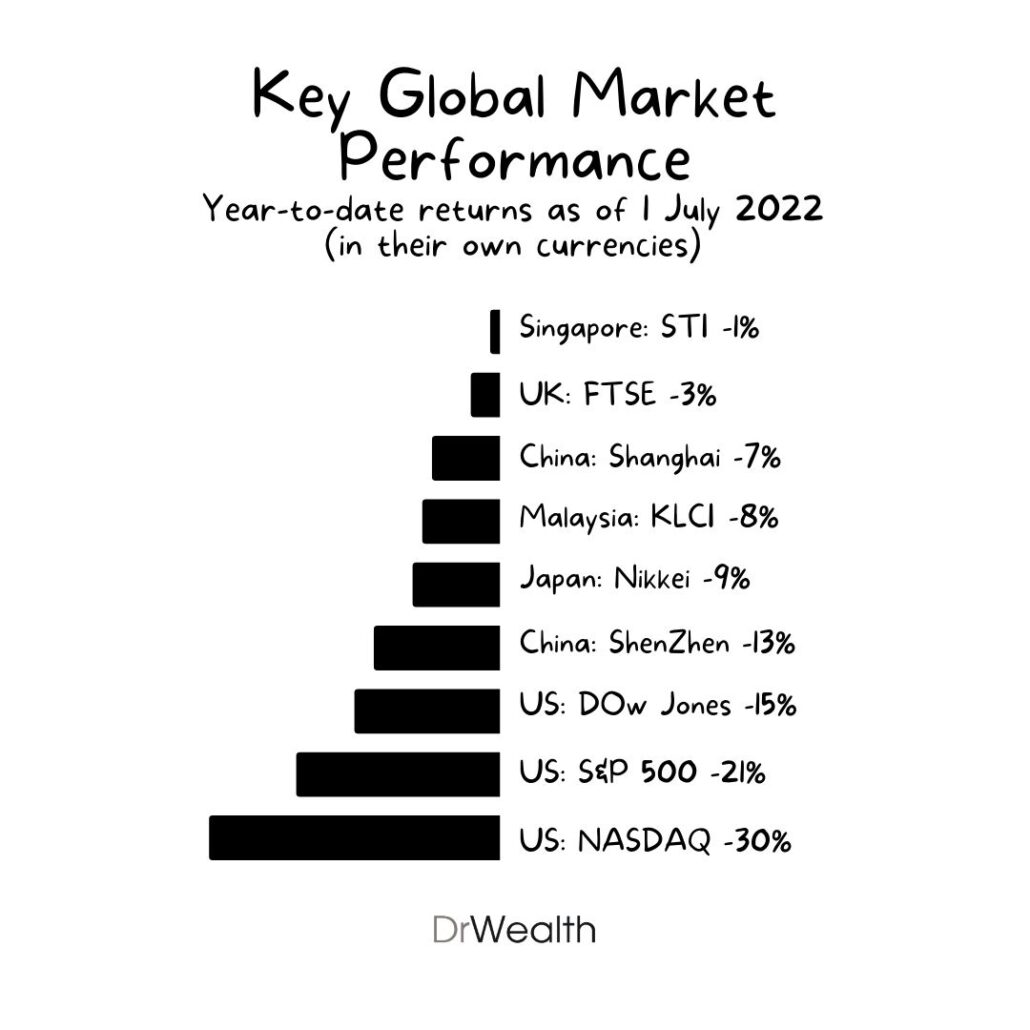
As Alvin summarised in his Finbite post last week, here’s how some of the key global markets have performed as of 1st Jul 2022:
- Singapore: STI -1%
- UK: FTSE 100 -3%
- China: Shanghai -7%
- Malaysia: KLCI -8%
- Japan: Nikkei -9%
- China: Shenzhen -13%
- US: Dow Jones -15%
- US: S&P 500 -21%
- US: NASDAQ -30%
In this article, we’ll drill down on the US markets, explore the best and worst sectors in the S&P 500 and take a look at how the big tech stocks (TAMAMA) and ARKK performed.
Let’s go:
6M/YTD 2022 Performance of US indices
| Index | 6M/YTD |
| Dow Jones | -15.9 |
| Nasdaq 100 | -30.3 |
| S&P 500 | -21.1 |
The US market ends the first half of 2022 with its worst performance since 1970 as both the S&P 500 and Nasdaq 100 fell into a bear market. For the Nasdaq 100, it is the worst ever performance in its shorter history as the index was created in 1971. While all three indices are still higher than end 2019 levels, all would have given back its 2021 gain and have dipped into 2020 levels.
For the Dow Jones, only 8 out of 30 stocks are in the green. 16 out of 30 stocks have outperformed the index. The stocks in the green include names such as Chevron, Merck, Amgen, Coca-Cola and IBM. Biggest losers include Cisco, Home Depot, Boeing, Nike and Walt Disney.
For the Nasdaq 100, only 14 out of 100 stocks are in the green. 61 out of 100 stocks have outperformed the index. The stocks in the green include names such as Constellation Energy, Vertex Pharmaceuticals, Activision Blizzard, T-Mobile, Seagen, AstraZeneca, Dollar Tree, Pinduoduo and Kraft Heinz. Biggest losers include companies Netflix, Paypal, Docusign, Lucid, Align Technology and Okta.
For the S&P 500, only 107 out of roughly 500 stocks are in the green. 275 of these stocks have outperformed the index. Besides the Oil sector stocks and stocks mentioned above, other stocks in the green include Archer-Daniels-Midland (ADM), AT&T, Campbell Soup and Mosaic Company. Biggest losers include names such as Etsy, Carnival Corporation, Caesars Entertainment, Illumina and Bath & Body Works.
Best and worst performing S&P500 sectors
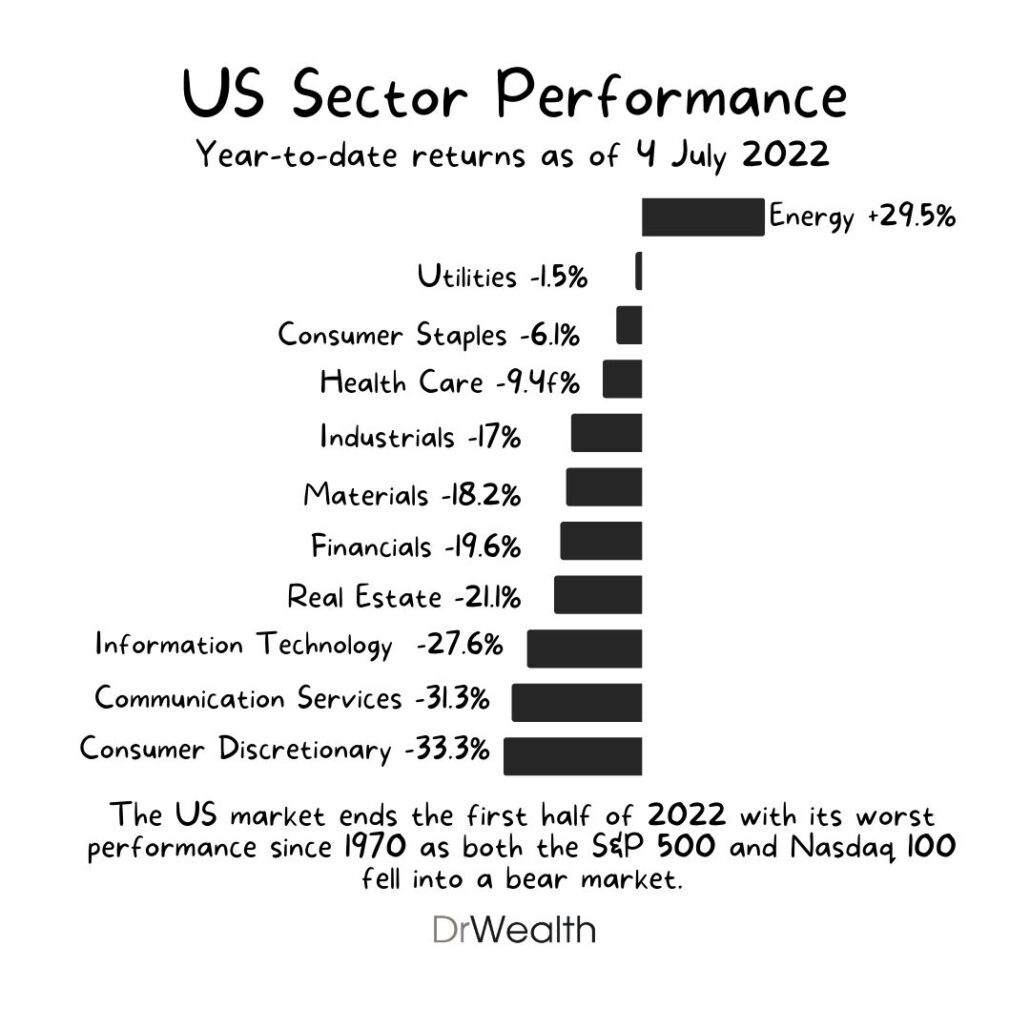
| Rank (from worst) | S&P500 Sector | 6M/YTD (%) |
| 1 | Consumer Discretionary | -33.3 |
| 2 | Communication services | -31.3 |
| 3 | Information Technology | -27.6 |
| 4 | Real Estate | -21.1 |
| 5 | Financials | -19.6 |
| 6 | Materials | -18.2 |
| 7 | Industrials | -17.0 |
| 8 | Healthcare | -9.4 |
| 9 | Consumer Staples | -6.1 |
| 10 | Utilities | -1.5 |
| 11 | Energy | 29.5 |
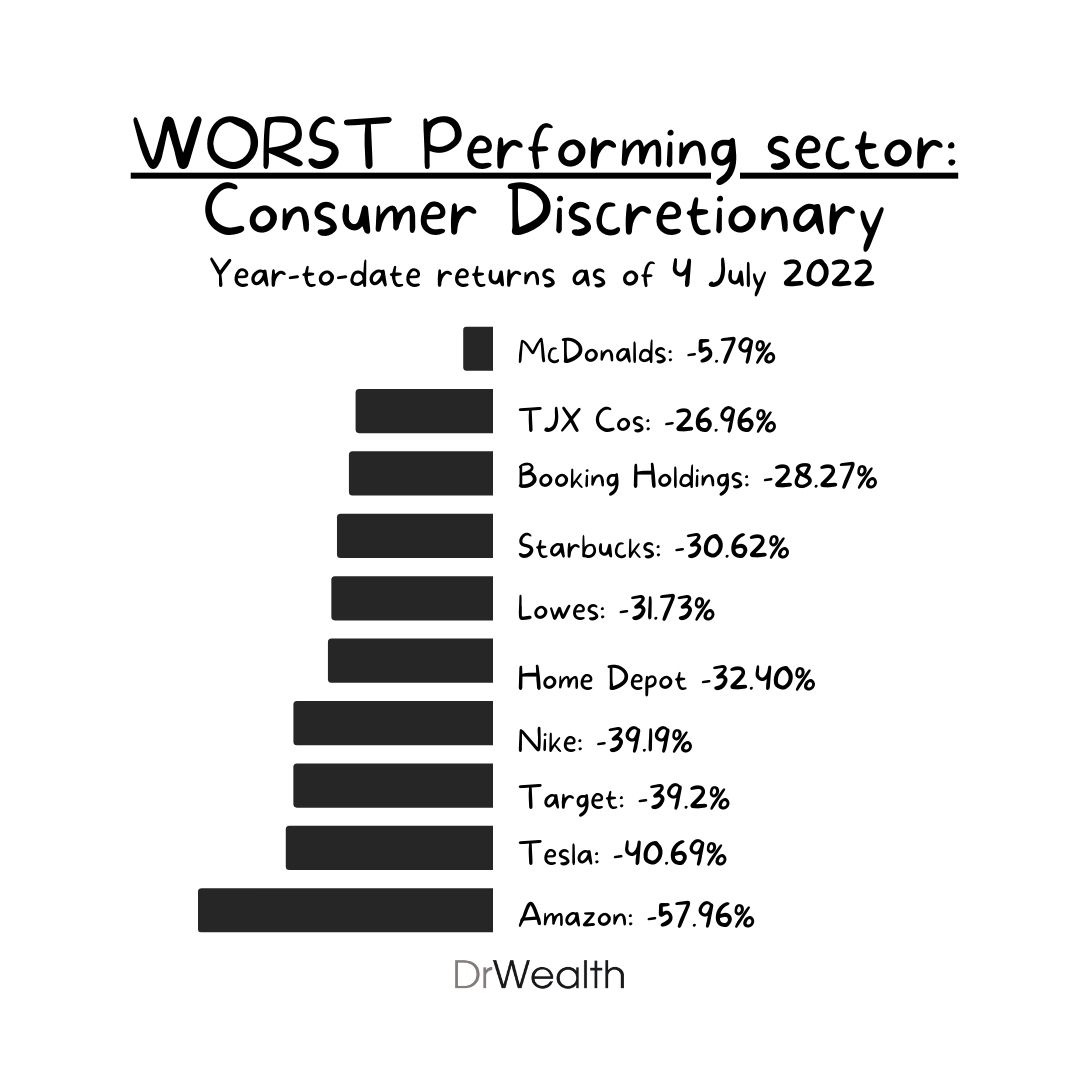
The worst performing S&P500 sector in 6M2022 was the consumer discretionary sector as it was impacted by supply chain, inflation and recession concerns. Top constituents by index weight for this sector include names such as Amazon, Tesla, Home Depot, McDonalds, Nike, Lowes, Starbucks, Booking Holdings, TJX Cos and Target. The worst performer in 2021 was the consumer staple sector at +16%.
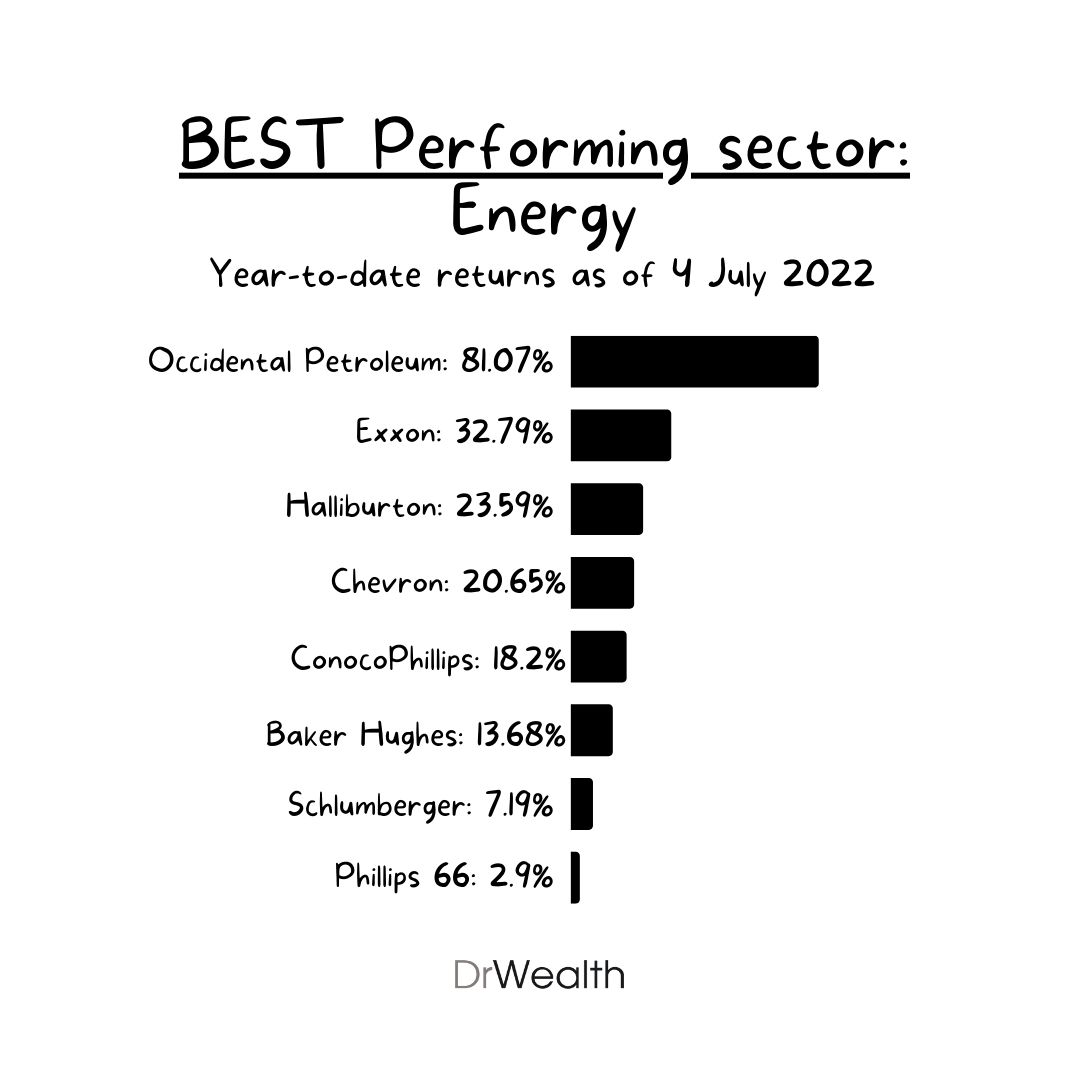
The best sector performer was clearly the Energy sector by far as Oil and Gas prices have remained elevated throughout the period. The Energy sector was also the best performer in 2021 at +53%. Top constituents include well known names such as Chevron, Exxon, ConocoPhillips, Occidental Petroleum, Schlumberger, Phillips 66, Halliburton and Baker Hughes
TAMAMA YTD performance
| Company | 6M/YTD (%) |
| Tesla | -43.9 |
| Alphabet | -24.9 |
| Meta platforms | -52.4 |
| Amazon | -37.7 |
| Microsoft | -23.3 |
| Apple | -24.9 |
Looking at the list of Big tech companies, the top performer of the lot was Microsoft with a -23.3% decline while the worst performer was Meta platforms (formerly known as Facebook) with -52.4%. While all six companies record losses, only three of them underperformed the Nasdaq 100 index decline of -30.3%, namely Tesla with -43.9%, Meta Platforms with -52.4% and Amazon with -37.7%.
Meta has been plagued with uncertainty due to ad demand headwinds as competition for ads continue to intensify. In addition, Meta has not seen meaningful increase in user numbers while competitors have grown its user base. Meta also started investing significant amounts into the Metaverse with a long term vision which has yet to bear fruit.
ARKK ETF Top 10 holdings YTD performance
| Company/ETF | 6M/YTD (%) | Weightage (%) |
| ARKK | -58.9 | – |
| Zoom Video Communications | -41.4 | 10.15 |
| Tesla | -43.9 | 8.56 |
| Roku | -64.8 | 8.43 |
| Crispr Therapeutics | -23.3 | 5.22 |
| UiPath | -58.5 | 5.18 |
| Teladoc | -65.1 | 4.66 |
| Exact Sciences | -51.7 | 4.55 |
| Block | -62.5 | 4.47 |
| Intellia Therapeutics | -56.5 | 4.09 |
| Twilio | -68.5 | 3.89 |
ARKK has been one of the largest underperformers in 2021 at -23.4% and in 6M2022 at -58.9%. With this 18 months cumulative performance of -68.5%, it means that for an investor who invested $100 into ARKK on the 1st of January 2021, the investor would be left with $31.5.
Looking at Ark’s flagship ARKK ETF’s top 10 holdings which account for 59.2% of the ETF, we have identified the Best and Worst performers to be Crispr with a -23.3% decline and Twilio with a -68.5% decline respectively.
Twilio’s plunge was reflective of many stocks in the high growth ARKK portfolio as sentiments for high value unprofitable growth stocks weakened. Growth rates has also come down after strong growth in 2020 and 2021 as many of these innovation stocks have found it difficult to continue its growth outperformance after two strong years.
This underperformance is in spite of Cathie Wood reiterating that the structural long term thesis for many of these innovation stocks continue to be intact and that current prices serve as an opportunity for the longer term.
Closing statement
The first six months of 2022 has been a period of overall decline with most indices declining either due to its previous outperformance or due to macroeconomic concerns such as inflation, supply chain constraints and recession. With interest rates rising, consumer confidence being tested over fears of rates of job losses rising and inflation, demand has also been dialled down across various sectors. The only clear outperformer has been the Energy sector.
If one refers to history as some form of indication, some hope lies ahead as when the S&P 500 plunged 21% in 1H1970, it reversed those losses to gain 26.5% in 2H1970. Of course, without referring to history, one would also know the concept of mean reversion and that when stocks go down, the good ones would eventually recover and even make new highs.
Looking for a way to value stocks? Read our free Value Investing Guide